LT4d: I can explain how inflation and exchange rates impact the value of resources.
POD:
1. Do Now
2. AOL Discussion (what it is, when it's due, etc)
3. Complete Money Booklet: Exchange Rates
4. Building an INFOGRAPHIC for Exchange Rates using EXCEL or http://infogr.am/beta/
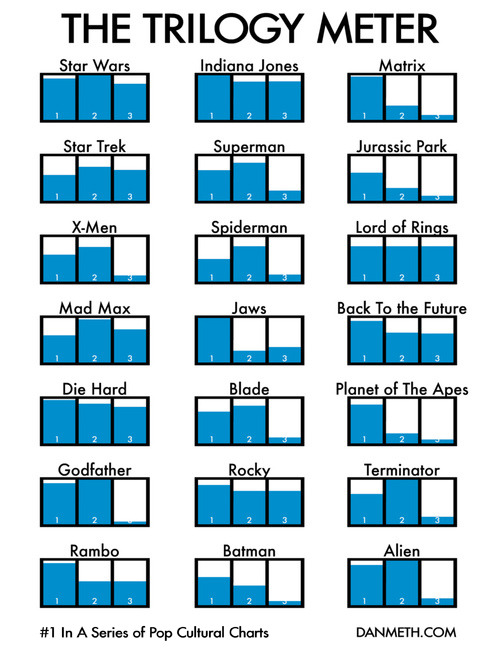
DO NOW: Answer these questions on the back of the image:
1. What is this data showing you?
2. What would you title this image?
3. What makes this image GREAT (quality factors)?
_______________________________________________________________________
TASK 2: AOL DISCUSSION
EXAMPLES of VIDEOGRAPHICS
http://econ.st/13hRUqK
http://www.pbs.org/pov/foodinc/trailer.php#.UX6AHoIW9eE
EXAMPLES of INFOGRAPHICS
|
|
|
Carland
|
_______________________________________________________________________
TASK 3:
VIII. Why do exchange rates change so much? (pg. 9) MONEY BOOKLET LINK.
1. When you exchange money, you are basically BUYING it… like you would buy sneakers or candy. So each country’s money has a PRICE, like any other good. Exchange rates are the PRICE of another country’s money.
2. The PRICE (exchange rate) of money is based on MANY factors, like inflation, interest rates, imports, exports, purchasing power, and FAITH in that currency.
3. Where is the Big Mac most expensive? Be sure to include the prices. Click here to view: Big Mac Index
4. Why do you think the EU adopted the same currency (view the EU's answer)?
5. What currency did you bring in? What VALUE does it have?
http://www.xe.com/
_______________________________________________________________________
TASK 4: Creating an INFOGRAPHIC
1. Question to Address
2. Where to get the data/cite it
3. How you want to see it (sketch it out)
4. Make it GORGEOUS.
5. Title and caption it.
_______________________________________________________________________
HOMEWORK:
1. Currency CHART (if you are Wade, Sabrina, Chelsea, Riley, Sebastian, Elijah, Abi and Cheyanne, you do not have to do this for HW!)
1) Go to xe.com and to chartgo.com
2) Figure out the DOLLAR exchange rate for five different currencies.
3) Use the data to create a basic bar chart. This should be ready to share digitally.
2. INFOGRAPHIC IDEA DUE Wednesday. You turn in the idea in the comment box BELOW with at least one data link.
3. DOCUMENTARY GROUP- owe TOMORROW in RenLab:
Idea Chosen, Format Chosen, Partner Chosen, and THREE CHUNKS Chosen
How food payments has changed over time.-
ReplyDeletehttp://www.theatlantic.com/business/archive/2013/03/cheap-eats-how-america-spends-money-on-food/273811/
how milk prices changed over time -jaretzy
ReplyDeleteHow many people die every year of hunger, shown over a long period of time in a videographic (ie first recorded data of how many dead - present) shown with a map where 1 year is 1 second hard to explain through text.
ReplyDeleteWhy we eat what we eat and the reasons behind it
ReplyDeletehttp://healthpages.org/basics-healthy-eating/why-we-eat-what-we-eat/
-Sebastian